Auditory neuroscience · Generative AI

From brain
activity to sound.

Reconstructing sound from fMRI with a directly conditioned audio diffusion model.

Brain signals in. Audio waveforms out.

fMRI → AUDIODirect conditioning
Neural activitySound reconstruction

A direct connection between auditory cortex and generative audio.

01 / The idea

Hearing through
brain activity.

Can a generative model reconstruct sounds directly from responses in the auditory cortex?

BrainSounds explores a direct route from fMRI beta responses to audio. Instead of first predicting an intermediate semantic representation, the framework converts neural responses into brain tokens that condition a pretrained audio diffusion model through cross-attention.

This provides a way to study both sound reconstruction and the contributions of different auditory cortical regions.
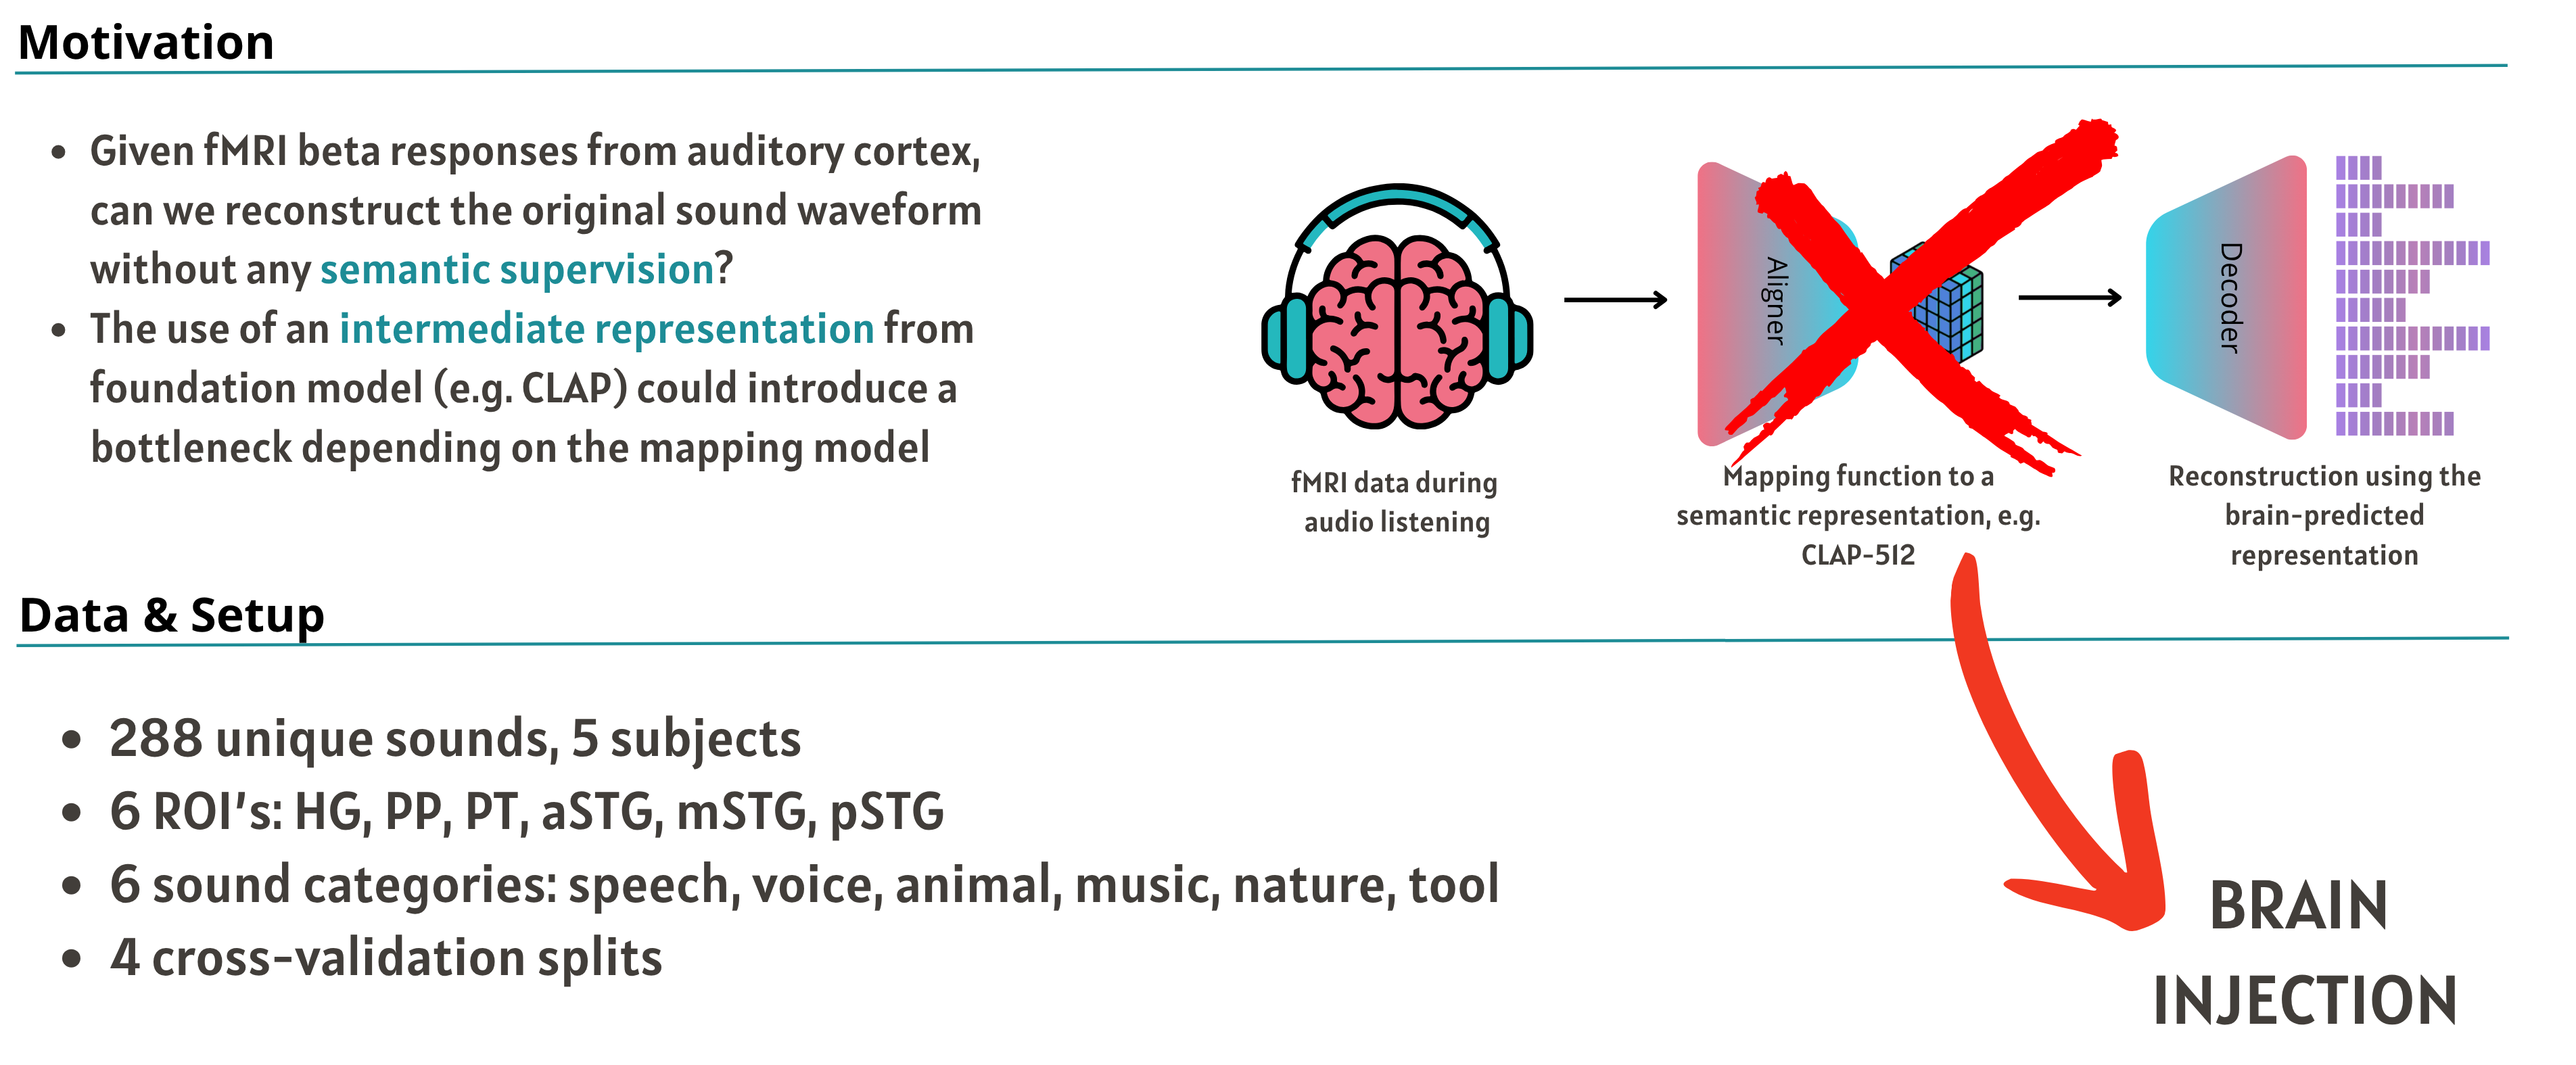
288unique sounds
5participants
6auditory regions
6sound categories
View the motivation and experimental setup Original motivation and setup slide: direct brain conditioning, 288 sounds, five subjects, six auditory ROIs, six sound categories, and four cross-validation splits↗

02 / The framework

A direct path to audio.

Brain tokens connect regional fMRI responses to the generative audio model.

01

Encode brain responses

Project fMRI responses from six auditory regions into regional representations.

02

Generate brain tokens

Combine the regional representations into conditioning tokens.

03

Condition audio diffusion

Inject brain tokens through cross-attention to guide sound generation.
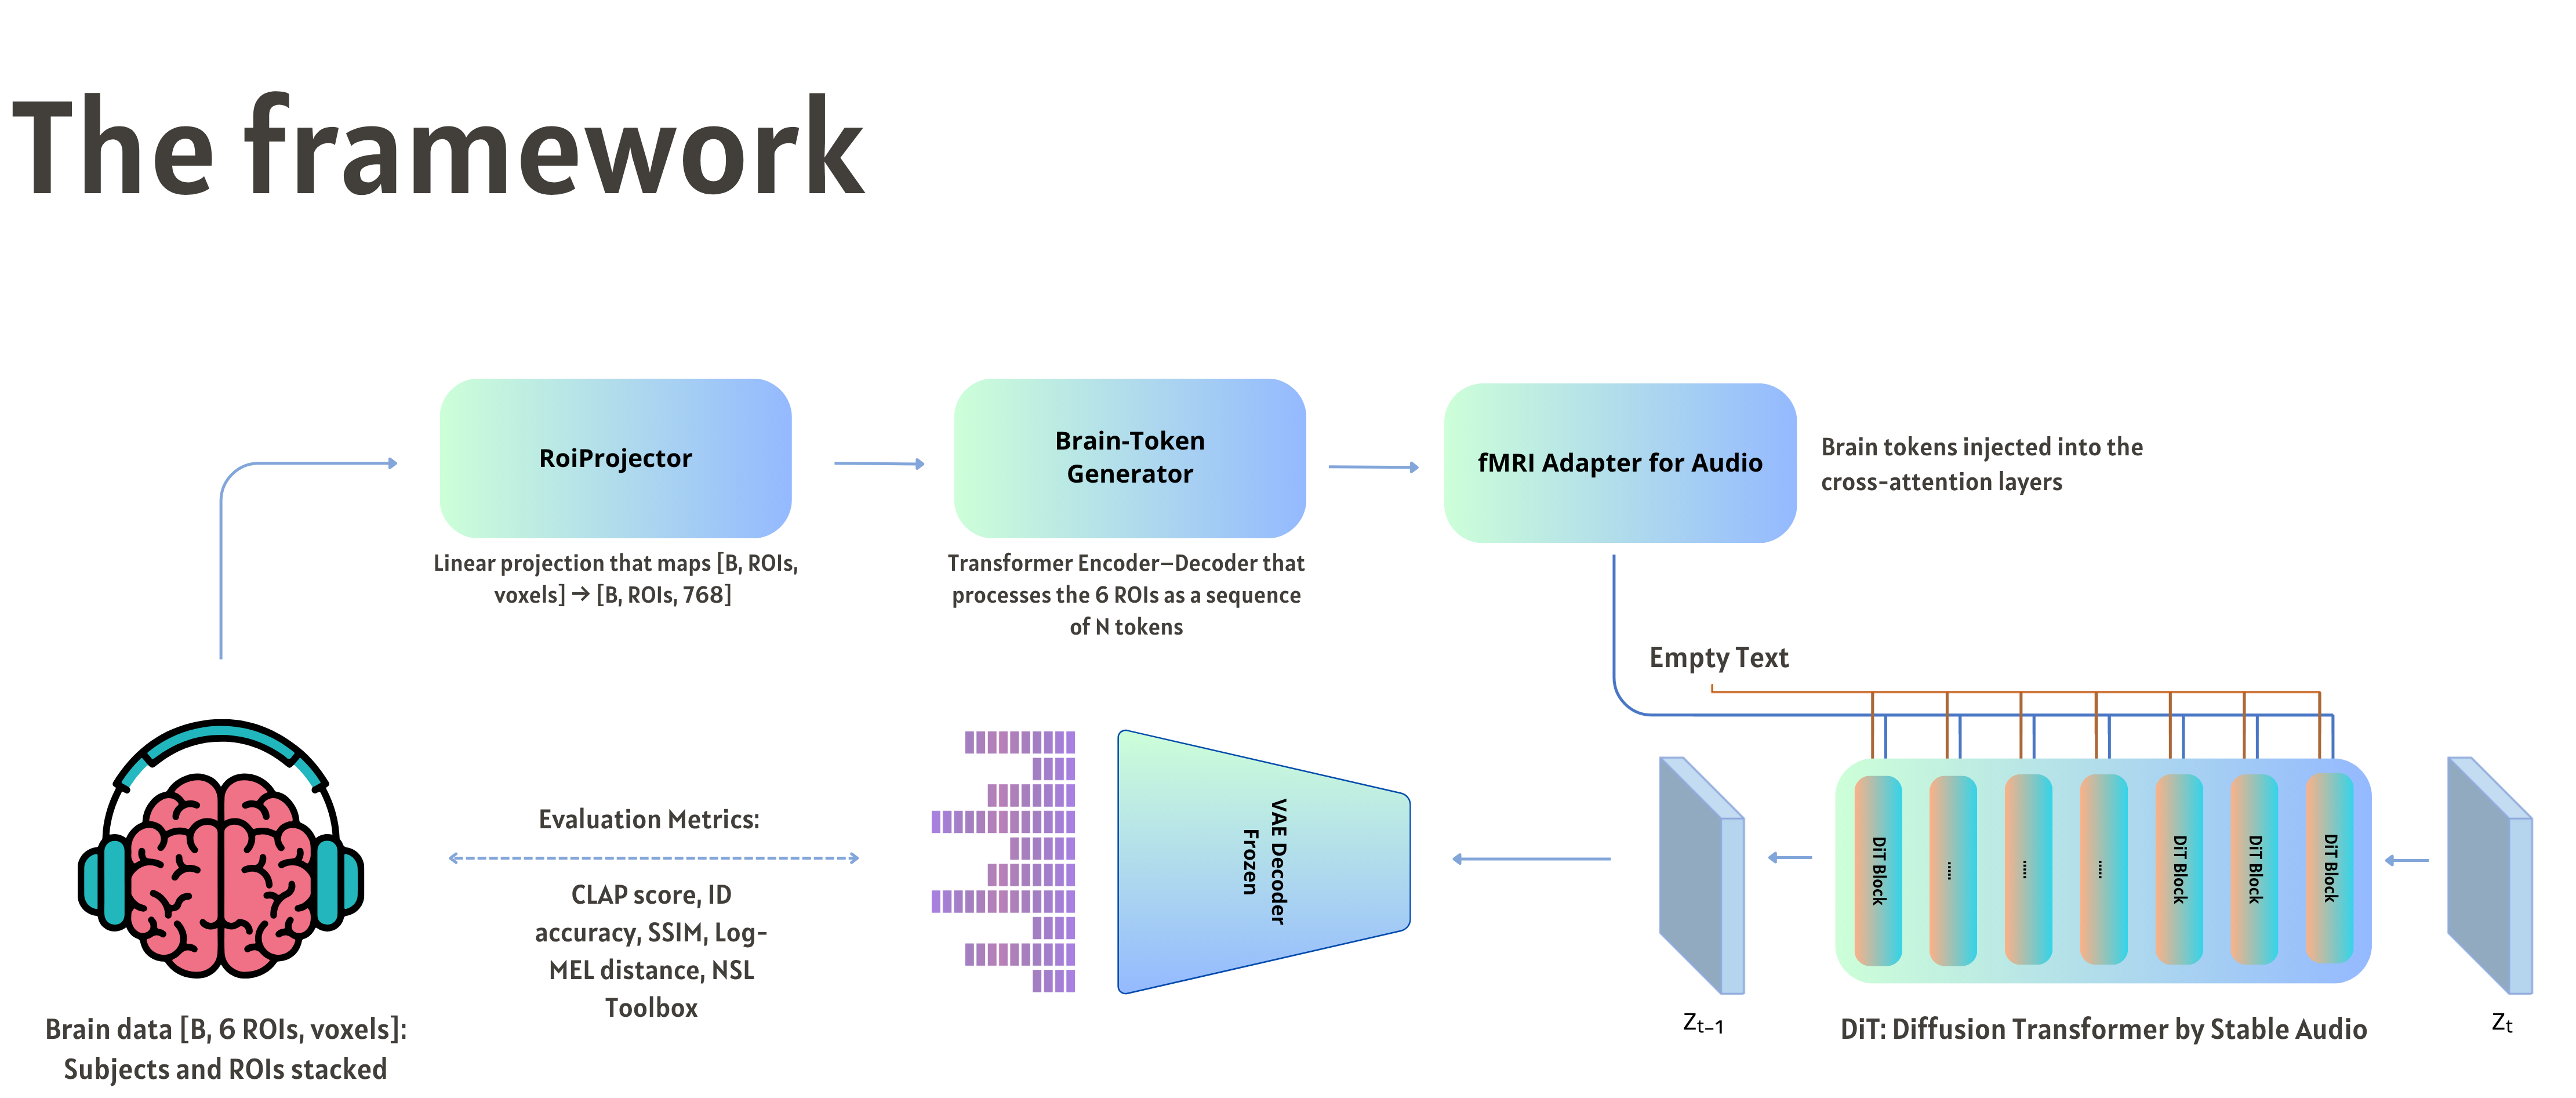
Framework: ROI projector, brain-token generator, fMRI adapter, Stable Audio diffusion transformer and waveform decoder↗
THE ARCHITECTUREFrom regional fMRI responses to a reconstructed waveform. Select the figure to enlarge.

03 / Listen & compare

The sounds, reconstructed.

Listen to the original stimulus and its reconstruction from fMRI. Each pair includes a spectrogram.

9 examples

Play either audio track to animate its spectrogram. Starting another track pauses the previous one.

04 / Cortical contributions

Which regions
shape the sound?

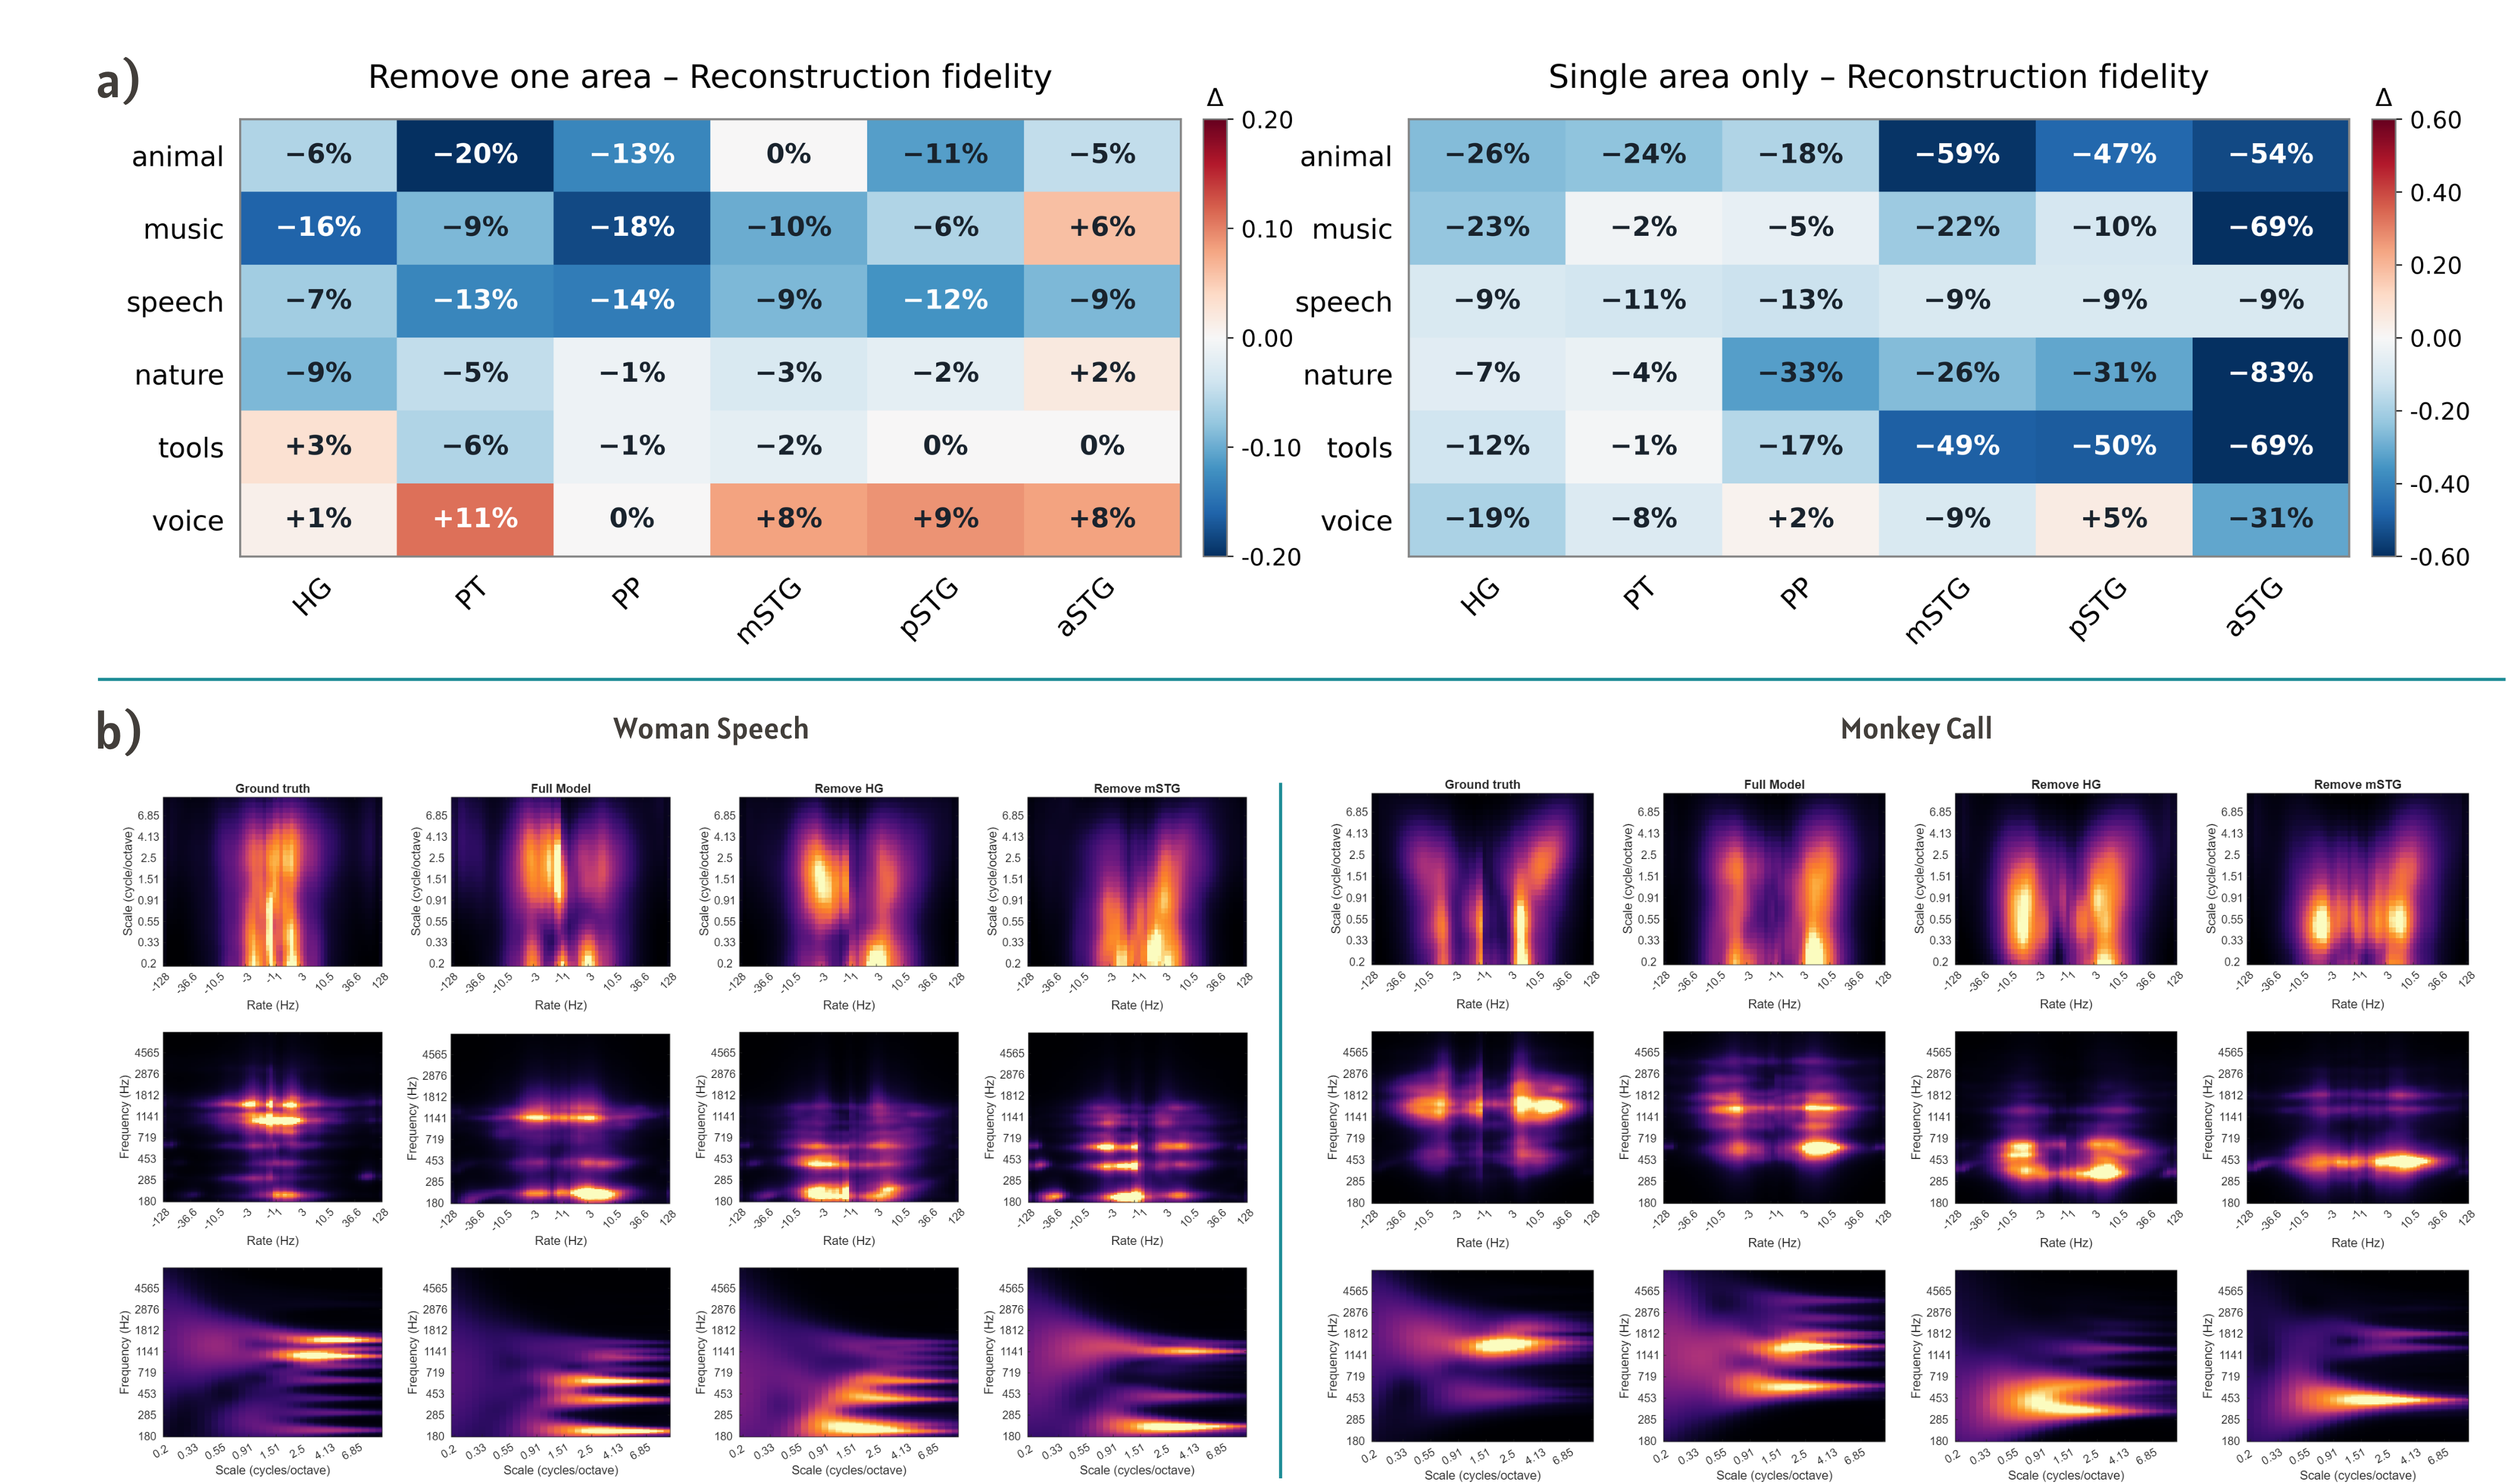
Exploring the role of individual auditory areas.

Removal and single-area analyses examine how reconstruction changes when a region is excluded or used in isolation. The figure compares reconstruction fidelity across sound categories and illustrates spectrotemporal changes in selected examples.
HGPTPPmSTGpSTGaSTG
Cortical contribution results: removal and single-area fidelity heatmaps, followed by spectrotemporal representations of woman speech and monkey call↗
REGION-WISE ANALYSISReconstruction fidelity and spectrotemporal representations across auditory regions.

05 / The generation process

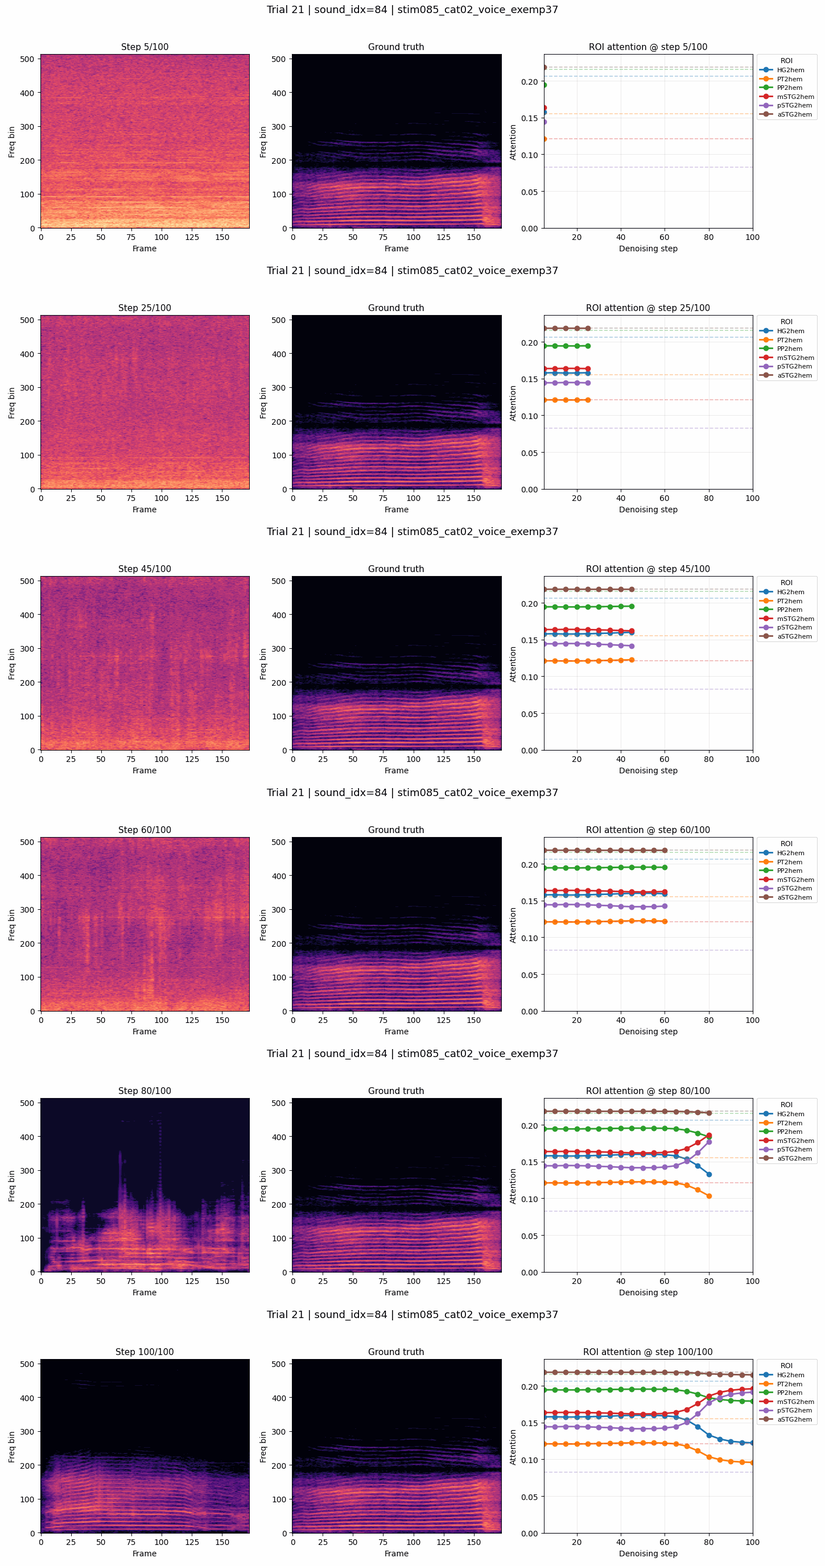
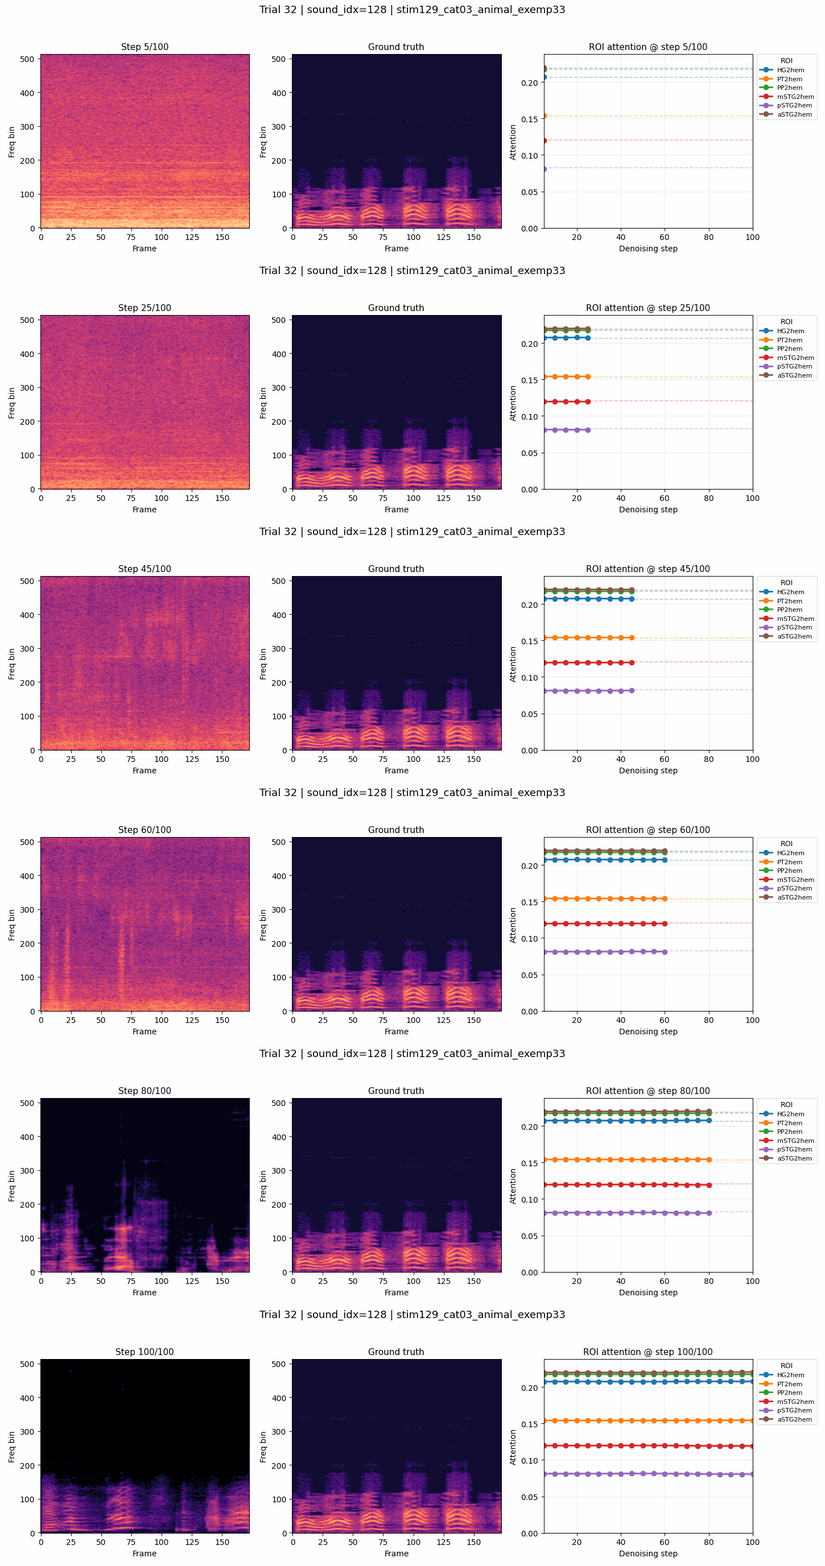
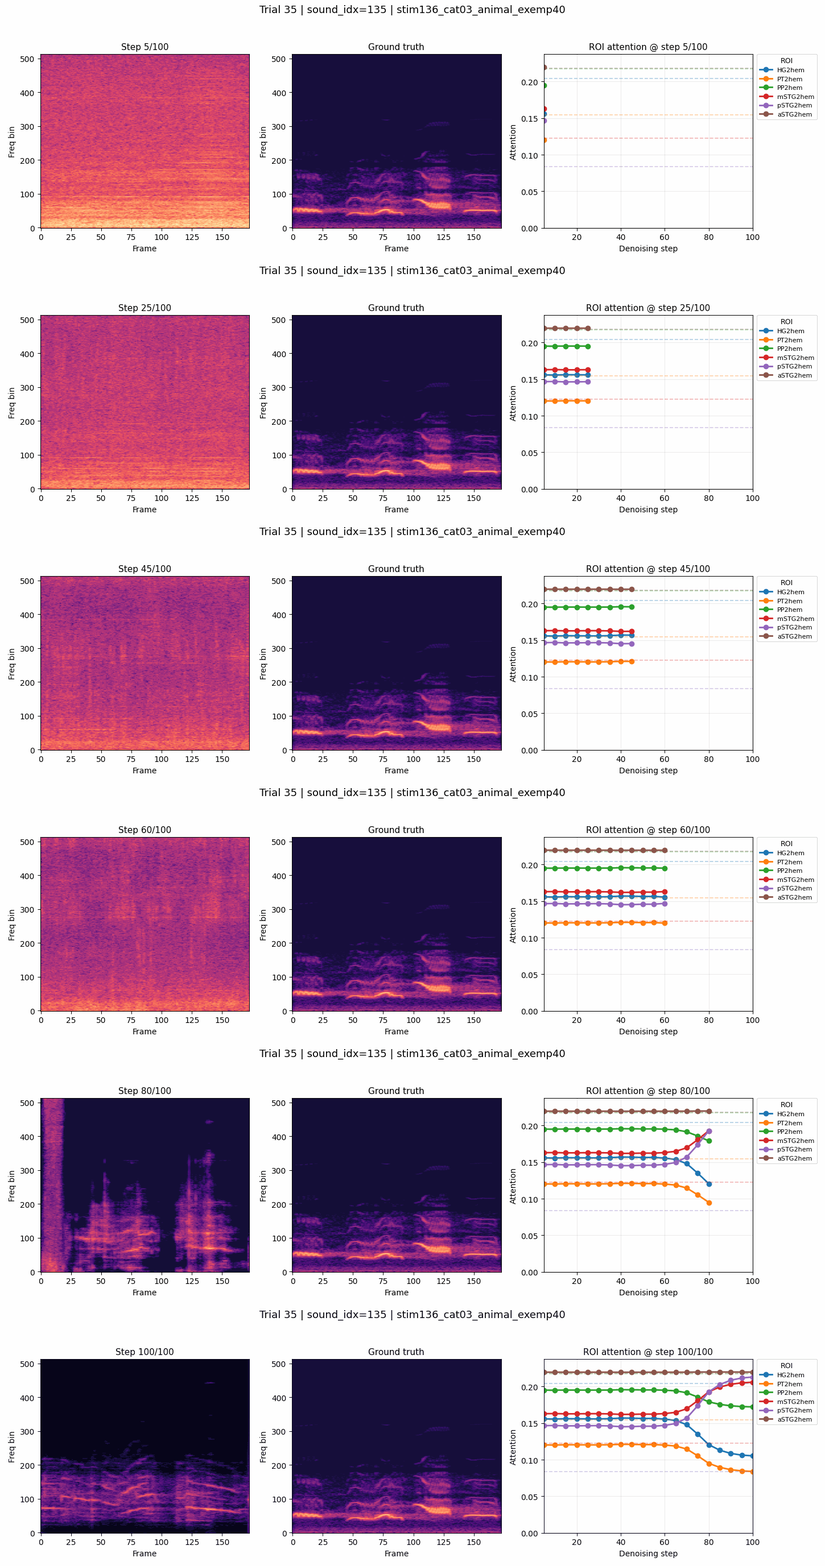
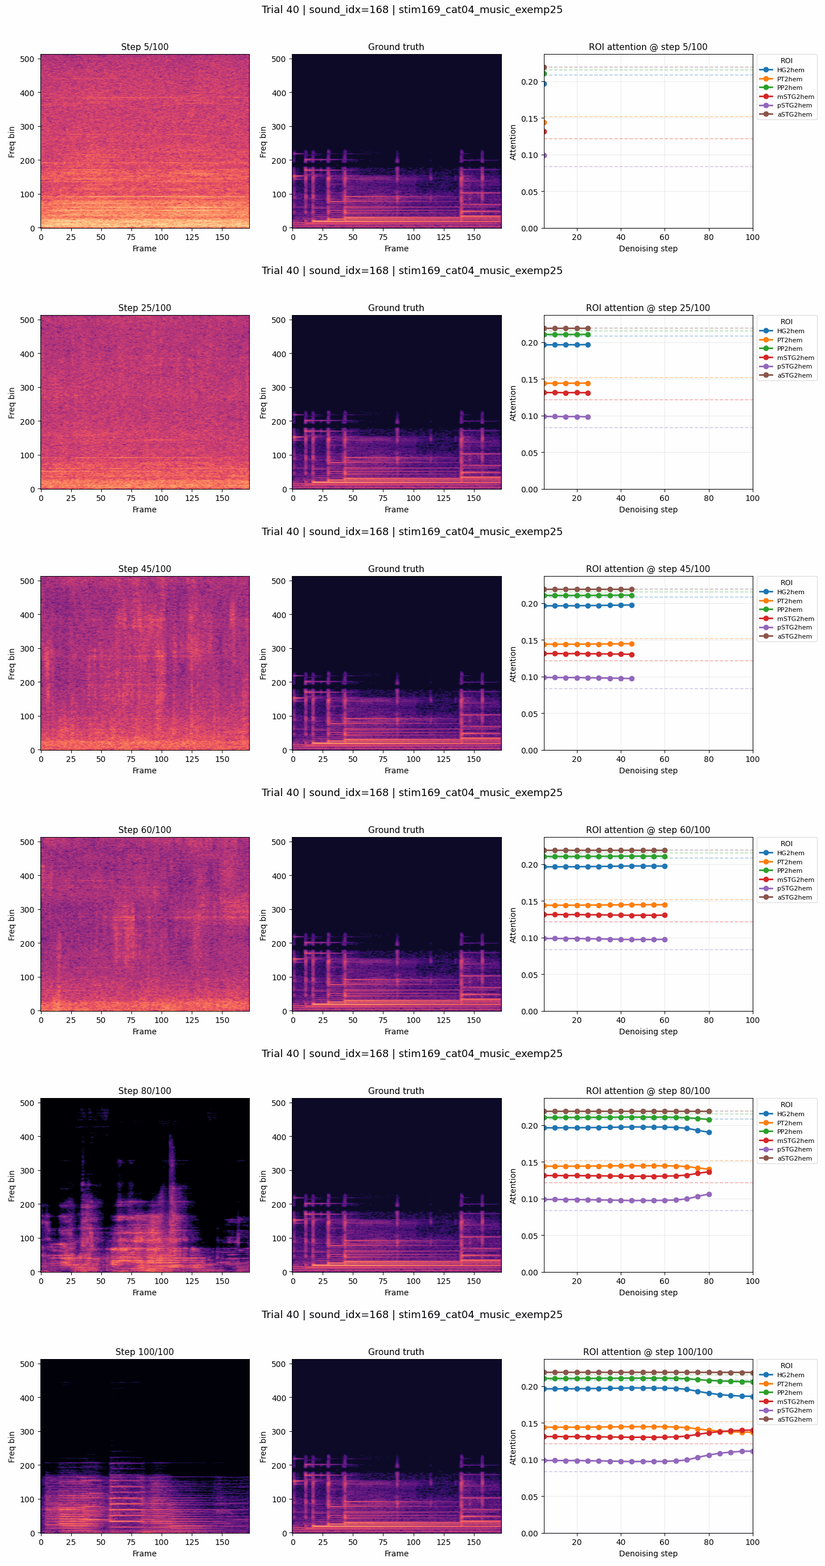
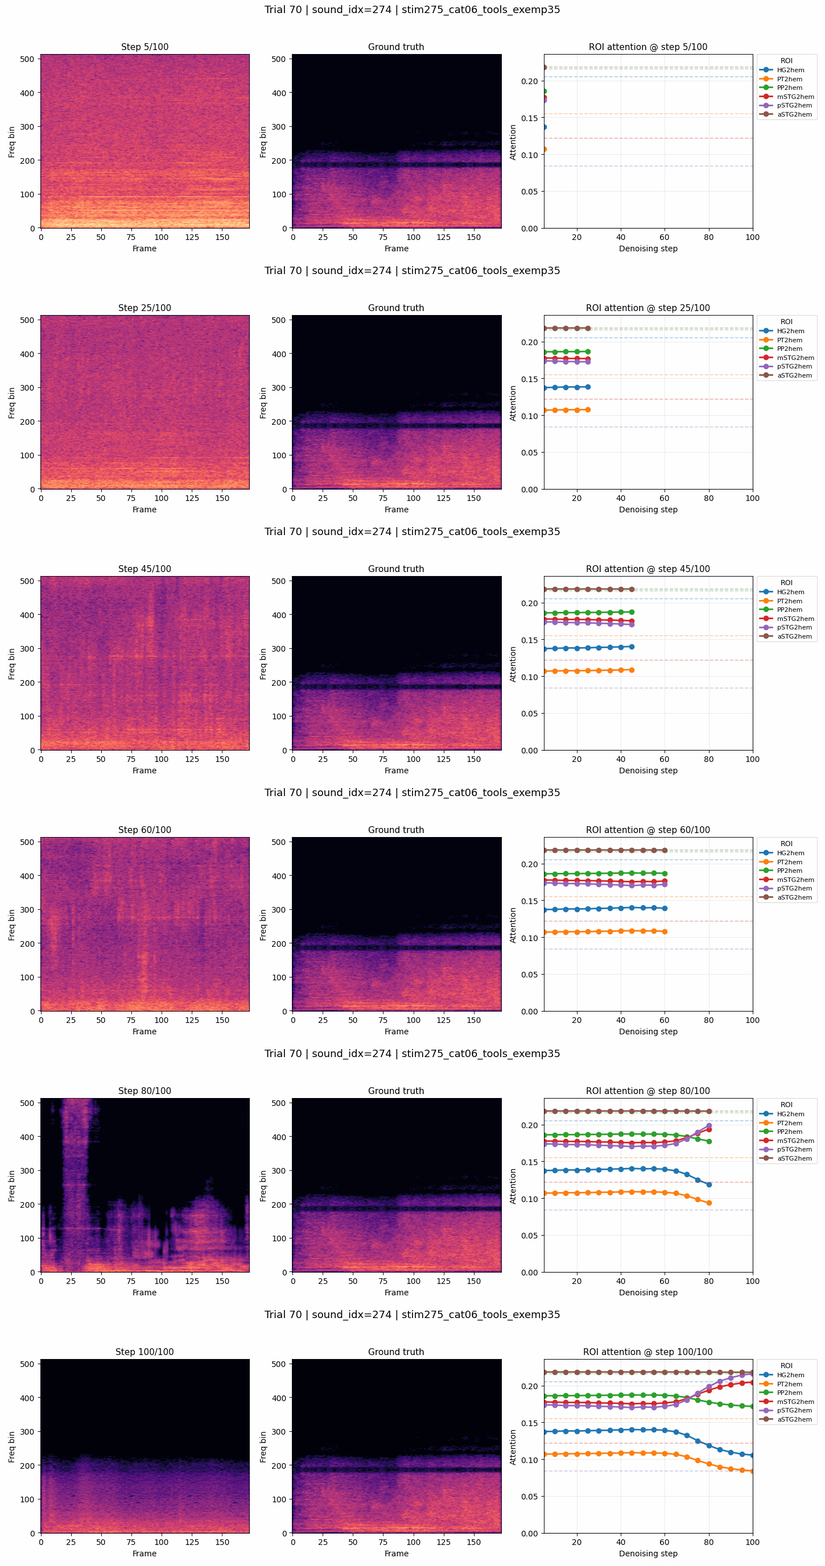
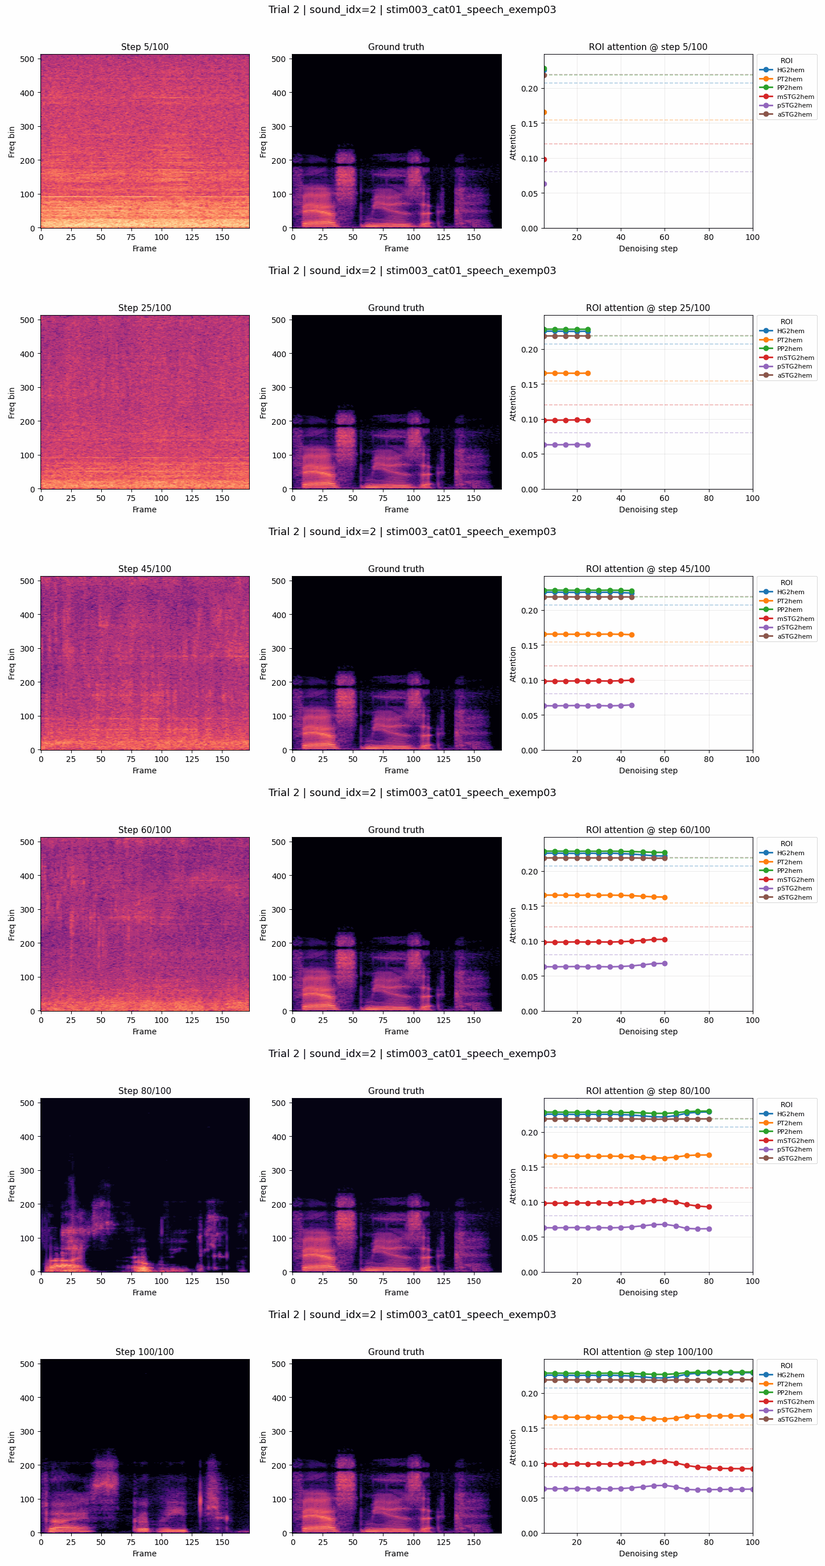
From noise to structure.

Explore how the reconstructed spectrogram evolves over diffusion steps. Select a sequence to play the animation.

Sound 0002

Trial 0002
Denoising sequence for trial 0002, sound 0002↗

Sound 0084

Trial 0021
Denoising sequence for trial 0021, sound 0084↗

Sound 0128

Trial 0032
Denoising sequence for trial 0032, sound 0128↗

Sound 0135

Trial 0035
Denoising sequence for trial 0035, sound 0135↗

Sound 0168

Trial 0040
Denoising sequence for trial 0040, sound 0168↗

Sound 0274

Trial 0070
Denoising sequence for trial 0070, sound 0274↗

06 / The team

Authors & affiliations.

Contact Matteo Ciferri

Matteo Ciferri1

Tonio Weidler2

Matteo Ferrante1,3

Nicola Toschi1,4,*

Elia Formisano5,*

  1. University of Rome Tor VergataDepartment of Biomedicine and Prevention
    Italy
  2. Maastricht UniversityMaastricht Centre for Systems Biology (MaCSBio)
    Faculty of Science and Engineering
    The Netherlands
  3. Tether EvoEl Salvador
  4. Massachusetts General Hospital & Harvard Medical SchoolAthinoula A. Martinos Center for Biomedical Imaging
    USA
  5. Maastricht UniversityMaastricht Brain Imaging Center
    Department of Cognitive Neuroscience
    Faculty of Psychology and Neuroscience
    The Netherlands

* Equal contribution.

Explore the research

Go deeper into BrainSounds.

Read the paper and explore the implementation.
Research figure